Performance Cockpit
Maps
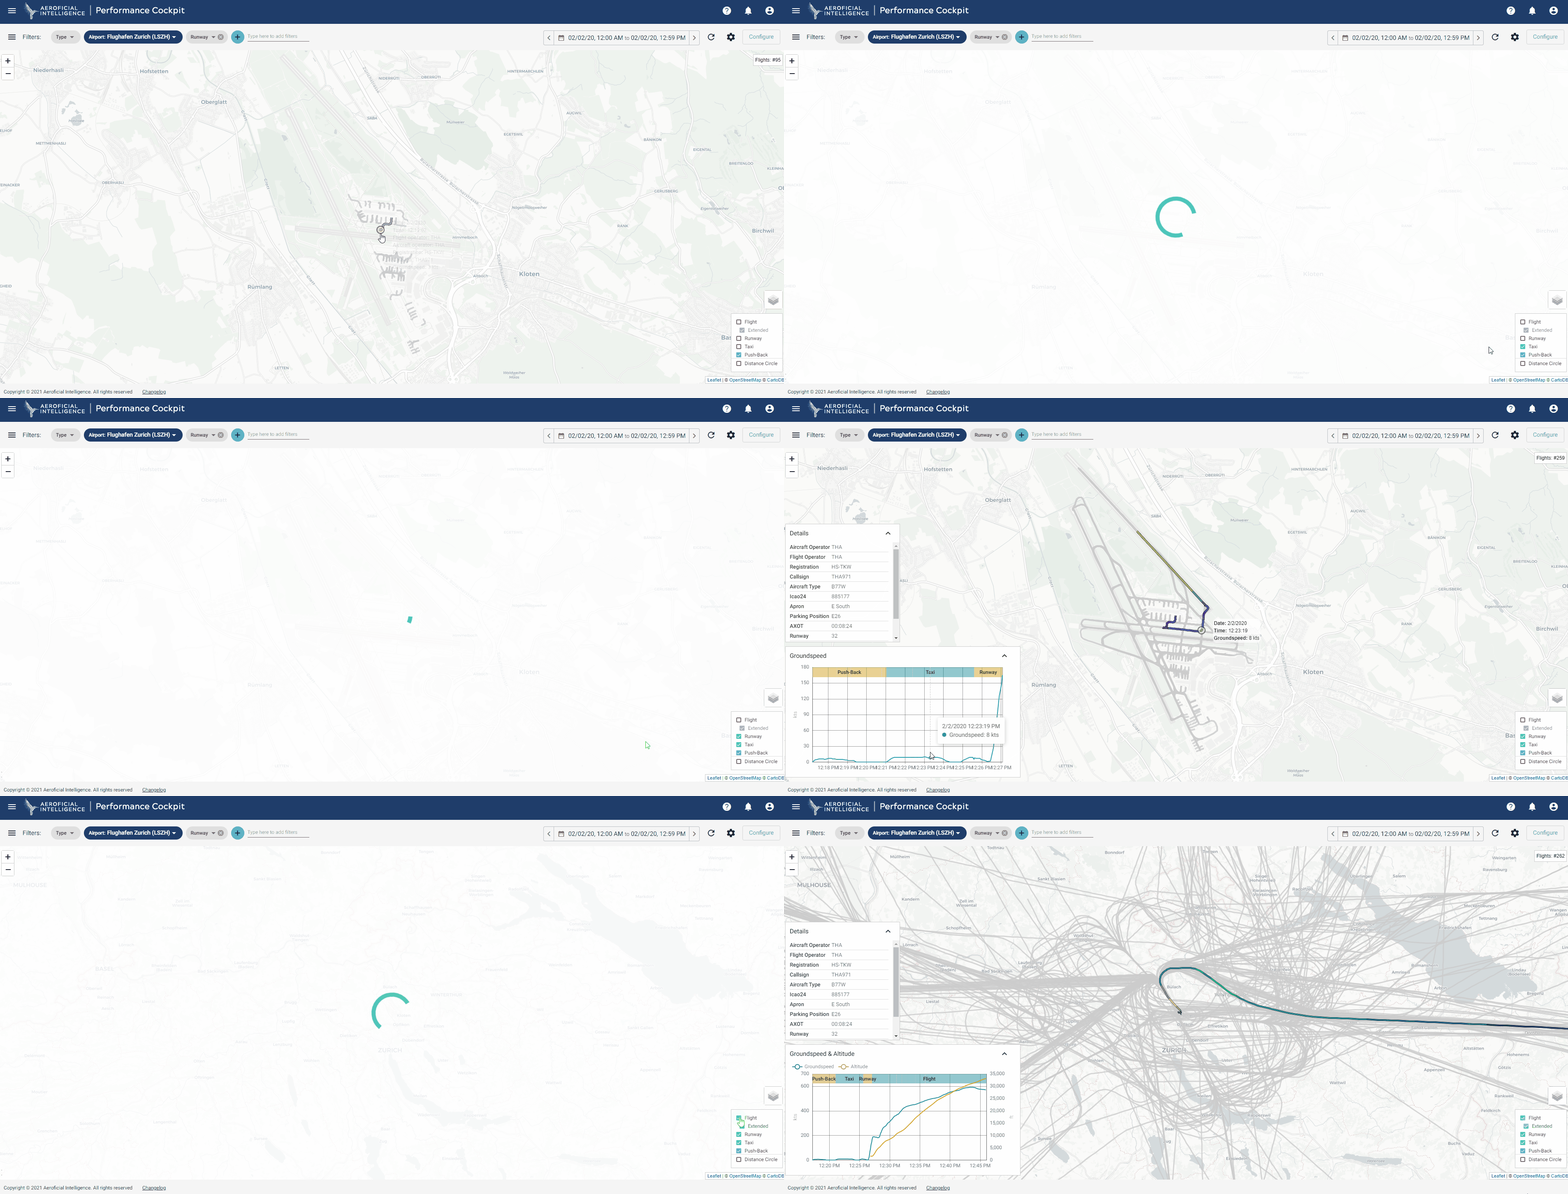
Maps is a root cause detective that finds the right answers.
Maps helps you to easily visualize flight and airside trajectories. With the wide range of filtering capabilities and KPIs, detours, go-arounds, delays, or taxi performance can be quickly identified. The time filter option enables users to freely select a timeframe that will be visualized. With different layering options such as airspace information on SIDs and STARs, most common flight routings are identified. This information is particularly important to analyze the airspace efficiency and evaluate options to adapt current procedures. With heatmaps airside bottlenecks can be detected easily. Maps is also capable of showing landing and take-off points in correlation with wind information to see safety performance. It is an extremely useful tool, for looking at outliers such as long taxi times and unusual behavior in the operations.
Benefits
Measuring airspace efficiency
Evaluate quality of arrival/descent profile and check CDA/CCO operations when implemented.
Flight visualization
Generate powerful visualizations of your daily operations at a specific airport to identify approach congestions such as detours and holding patterns.
Route Cause Analysis
Analyze your taxi processes at the airport and identify possible safety issues such as speeding on taxiways or high cornering speeds.
Infrastructure bottleneck identification
Identify ground infrastructure bottlenecks such as runway crossing waiting times, holding point times, queuing before take-off or de-icing waiting times.
Features
- STAR/SID layer
- Heatmaps
- Switch between ground and air
- Connect flight tracks with KPIs
- Advanced filtering options
- Different trajectory thickness and coloring
